First. Samuli Ollila wrote a preliminary manuscript demonstrating that the widely used Berger force field appeared to have some trouble correctly reproducing the lipid head group conformations measured in NMR experiments. Also responses to changes in hydration levels, ion concentrations and cholesterol content differed between experiments and simulations with the Berger model. Other force fields were not tested.
Then. During the last two weeks data for Stockholm-, Kukol-, OPLS-AA-, and the unpublished Maciejewski–Rog force fields have been made available by commenters (thanks guys!) of this blog.
Now. The plots below summarize the current status of our knowledge:
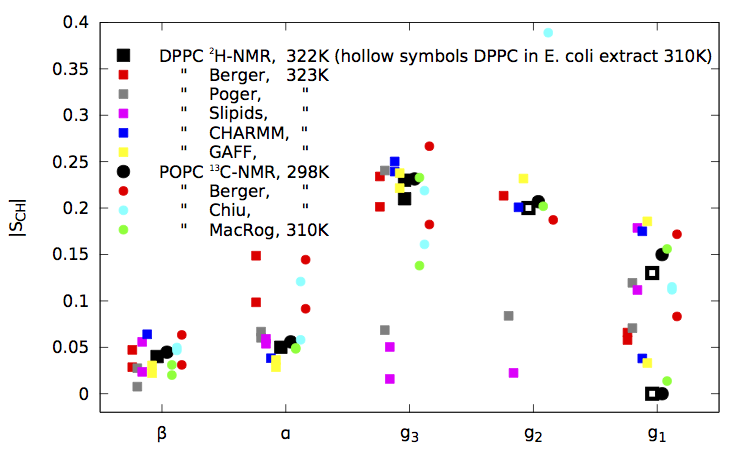 |
| Figure 1. NMR results, original Berger data, contributions obtained through the blog so far, and the GAFF and CHARMM results taken from the publications for pure fully hydrated bilayers. (Figure last updated on October 26th 2013.) |
 |
| Figure 2. Data of systems containing NaCl for the Kukol and OPLS-AA force fields. (For these we currently have no data of pure fully hydrated bilayers and thus decided not include them in Figure 1.) |
It seems that in addition to the GAFF and CHARMM, which were known to be good, also the Maciejewski–Rog force field gives significantly better order parameters than the Berger model.
Next. As always, all contributions are warmly welcome. However, here are maybe the most critical things we should obtain next:
- Response of the good all-atom force fields (GAFF, CHARMM, Maciejewski–Rog) to changing conditions: hydration levels, ion concentrations, cholesterol content. If you have done simulations with these force fields and would be willing to either (1) share the input files for Gromacs or (2) report the order parameters here, it would be a great benefit for the project. (All contributors will become authors of the final paper, see the post On credits.)
Order parameters from Chiu et. al. united-atom force field. They have put effort in parametrizing headgroup torsions, thus this could be the united atom force field that gives a significant improvement over Berger. Here the input files seem to be available, but if ready trajectories already exist, posting order parameter data would be very useful.Update on Oct 8th: This FF has now also been tested, see comment by Samuli below. Figure 1 has been updated accordingly.- Comments, questions, criticism. There are errors in all manuscripts, and we would be very grateful if you would report should you have found one—no matter how small or big. For example, based on the feedback we have got outside this blog, there are people who have known for a long time that the headgroup is not well described in the Berger model. We would be very grateful if you could share your insights and, e.g., point out missing relevant literature in the manuscript. Another cool example of a very relevant contribution could be if an impartial NMR expert could provide us with their insight and write a post on the reliability of the experimental data used for the comparisons. But these are just examples. Please let us know if there is anything that you think we should have taken into account.
markus & Samuli
I ran a POPC simulation with parameters by Chiu et al. [JPCB 113, 2748–2763 (2009) http://dx.doi.org/10.1021/jp807056c] and calculated the order parameters: https://www.dropbox.com/s/m19hyde3eg0ua2p/OPchiuCOMP.png
ReplyDeleteThere is no improvement compared to the Berger.
The simulation was 56ns long, where last 50ns was analyzed, T=298K. The *mdp file is here: https://www.dropbox.com/s/3xy0ko4ggub2909/chiuMDP.mdp and rest files I dowloaded from here:http://www.nanoconductor.org/43A1-S3/
The results in numbers:
1 0.0466445
1 0.0498179
2 0.058058
2 0.120818
3 0.160864
3 0.218773
4 0.388865
5 0.111903
5 0.115047
Thanks! I updated Figure 1 and the todo-list in the post.
DeleteIn the original posting only the first 75 of the 128 lipids were included in the analysis, because of a bug in the analysis script. Samuli Ollila provided (one-to-one communication) the following data with the fixed script, now also including the signs, on 10 April 2014:
Delete1 0.0426666
1 0.0569406
2 0.0570063
2 0.126138
3 -0.153322
3 -0.218152
4 0.424207
5 0.109495
5 -0.0473216
After an email exchange with Markus, he suggested to upload somewhere the topology for POPC from Dickson et al. that I've converted from the AMBER format to Gromacs. I've put the files and the protocol used to get them here https://gist.github.com/mretegan/6892382.
ReplyDeleteThanks for the files.
DeleteI did ran a simulation of POPC bilayer with 72 molecules by using these parameters. I needed to add the TIP3P parameters which I took from amberGS.ff/ffnonbonded.itp. I constructed the initial structure using the structure from here: http://lipidbook.bioch.ox.ac.uk/package/show/id/142.html. All the files I have used for the simulation and analysis, and the final structure are here: https://www.dropbox.com/s/mclbdm4g8aml6dv/GAFFrunfiles.tar
The simulation was 55ns long. After the 5ns the area per molecule was roughly unchanged. The area per molecule averaged over the last 50ns was 60Ų which is lower than 63.74Ų reported by Dickson et al. The ideas what could the reason for this are very welcomed.
The order parameters for the headgroup region compared to the ones reported by Dickson et al. are here: https://www.dropbox.com/s/3nlw6eca2ee2c08/dicksonCOMP.png. They are not exactly the same. At this point I am not sure if the difference is due to the POPC vs. DPPC difference, or due to the transformation of parameters to the Gromacs format. It could be the first since Dickson et al. report slight change in the headgroup tilt between DPPC and POPC. It could be the latter since the area per molecule is not exactly reproduced.
The order parameters compared to the experiments and the Berger results is here: https://www.dropbox.com/s/w1plwt70nchly7v/OPcompGAFF.png. Compared to the experiments the result is similar to the results reported by Dickson et al., except for the beta which is too low.
Despite of these issues I will try the response of this model to the dehydration to get some idea how GAFF lipids would react.
Correct link to the inital structure in the above post is this:
Deletehttp://lipidbook.bioch.ox.ac.uk/package/show/id/150.html
Actually the link that I've posted initially was also correct. The parameters were updated just after my original post (http://lipidbook.bioch.ox.ac.uk/user/profile/name/cd709.html). The mass of the hydrogen atom was incorrect (1.088) in the original set. I've updated and migrated the converted parameters here https://github.com/mretegan/GAFFLipids2Gromacs. It has all the history and since the original parameters were open data, I've added them to the repo.
DeleteI've also added the result for the energy term in Gromacs. They should be identical to the ones from AMBER. Unfortunately I don't have access to check this, but based on the extensive testing that acpype was put trough I doubt that they were going to be different.
Can this small difference in mass explain the behavior?
Small udate: I am testing the effect of mass. I also noticed that I constrained all bonds while Dickson et al. constraint just the bonds related to the hydrogens. I am testing this as well.
DeleteI have now ran a new simulation with fixed masses and constraining only bonds related to the hydrogen atoms. The average area per molecule is 61Ų from 50ns simulation. This is 3Ų smaller than reported by Dickson et al. I think that the reason is that they are using Langevin thermostat to control the temperature. In previous work from the same group they say that the Berendsen thermostat produces roughly 3Ų smaller area per molecule compared to the Langevin thermostat (Rosso et al. JCT 29, 24 (2008) dx.doi.org/10.1002/jcc.20675). I am using v-rescale which, based on my own experience, gives the same area per molecule as Berendsen. It might be possible to excatly reproduce the simulation by Dickson et al. with gromacs by using Langevan dynamics, but it is not straighforward for me.
DeleteThe headgroup and glycerol order parameters from my simulation compared to the simulation by Dickson et al. are shown in here:
https://www.dropbox.com/s/4cwufggg7ahvey3/DICKSgromacsCOMP.png
There are some differences. They might arise due to the differences in POPC and DPPC, differences in temperature, or differences in AMBER and Gromacs implementations. For this reason, I think that I have to run a simulation of GAFFlipid with gromacs for DPPC bilayer at T=323K. It would be great help if somebody would give me a dppc.itp made in a same way as Marius has done the popc.itp.
I've added the DPPC parameters to the repository. This time I've added the verbatim files obtained from acpype, DPP_GMX.gro and DPP_GMX.top, without renaming them.
DeleteI ran 48ns long simulation with the DPPC parameters by Marius. The area per molecule was roughly constant after 10ns. I analyzed the data between 20-48ns. The average area per molecule was 57Ų which is roughly 4Ų smaller compared to the results by Dickson et al. The order parameters are compared to the results by Dickson and my previous results to the POPC are here:
Deletehttps://www.dropbox.com/s/c79kn6c3aldz2jd/DICKSgromacsCOMP2.png
In conclusion I would say that I am not able to reproduce the results by Dickson et al. This is probably due to the thermostat issue discussed above. I think that at this point I will not use these simulations to the to check the response of GAFF model to dehydration.
The easiest solution for me would be to find out the way how to use Gromacs Langevan dynamics to reproduce the AMBER Langevan thermostat. If anyone has done that and successfully reproduced AMBER simulations, sharing the information how to do it in practise would be great help.
I red this post http://permalink.gmane.org/gmane.science.biology.gromacs.user/60671 and compared Amber and Gromacs manuals. If I got the things right, running Gromacs with:
Deleteintegrator = sd
tau_t = 1
bd-fric = 0
is equal to the Langevin thermostat used by Dickson et al.
I continued the previous DPPC simulation by Langevin dynamics with the above values. The length of the continuation simulation was 50ns However, the area per molecule did not essentially change and there is not visible drift. The average was 58Ų. Thus running Langevin simulation did not help to reproduce the simulations by Dickson et al. The order parameters for the headgroup from the Langevin simulation are here: https://www.dropbox.com/s/ii2zsc89x5vqqzy/DICKSgromacsCOMP3.png
The results are pretty similar to the previous ones for the GAFF reported in this discussion.
I think that I will try dehydrated run with this model anyway to get some idea how it would behave.
The order parameters with sign, calculated with new script from GAFFlipid DPPC simulation are here:
Deletehttps://github.com/NMRLipids/nmrlipids.blogspot.fi/blob/master/DPPCgaff/OrderParametersWITHerros.dat
The parameters for Samuli's GAFFlipid DPPC simulations were:
Delete72 lipids, 2197 waters = 31 w/l. 323K. Simulated 90 ns, of which first 40 ns with leap frog integrator, the last 50 ns with Langevin. Last 50 ns analyzed.
Just wanted to let you know that studying the response of the Maciejewski–Rog model to changes in hydration level and ion concentration are in the works.
ReplyDeleteI would like to add some earlier results from a modified version of CHARMM published in JCC, 29, 2359 (2008) (results for DMPC are from that paper but for POPC remained unpublished). Water is flexible SPC. 100 ns at 303K NPT, Ewald.
ReplyDeleteDMPC POPC
beta -0.046 -0.040,-0.044
alpha 0.088 0.082,0.106
g3s -0.206 -0.202
g3r -0.291 -0.260
g2 -0.182 -0.168
g1s 0.013 -0.004
g1r -0.132 -0.113
(for DMPC only average order parameter for alpha and beta is shown but anyway splitting is low)
what is remarkable is that this force field have headgroup parameters very similar to Slipids (the same way of derivation of charges) but does not show low order parameters for g3 and g2 as reported for Slipids by other participants
Thanks for the results and pointing out the paper!
DeleteI plotted your results for POPC together the ones with Berger and experiments:
https://www.dropbox.com/s/t7bnase3y1y9g4u/OPhogbergCOMP.png
Couple of questions:
Is the splitting in alpha lower for DMPC than for POPC?
Have you checked from your own simulations with Slipids that you get similar low order parameters for glycerol as reported here by other people?
Do you have any idea what could be the reason leading to these differences?
My impression from the GAFFlipids and CHARMM papers is that tuning the dihedral potentials have improved the order parameters. Could the difference between modified CHARMM and Slipids come from those?
Thank you!
DeleteFor DMPC the splitting for alpha and beta was indeed even less, within 0.002 in the both cases. I think they should converge to the same value as there is no principal difference between the hydrogens (this is not the case of glycerol group which is chiral)
We have not yet checked out data from Slipids, will do this . The torsion parameters in Slipids for the glycerol group are the same as in charmm36
Indeed, it looks like that for the CHARMM the order parameters for different hydrogens in the alpha and beta carbons are essentially equal, as it should be based on the experiments. I have got similar results from my own simulations as well (in the discussion below).
DeleteCuople questions related to your comment:
Do you mean that the different order parameters for the different hydrogens in the same carbon arises from the chirality of the molecules? Would you have a reference for this or could you explain it a little bit more?
If the torsional potentials are the same for Slipids and CHARMM, could the partial charges be then the main reason for the different order parameters for the glycerol part? I think that in the CHARMM they have fit the torsional potentials to reproduce the order parameters. In this case, these torsional potentials may not be transferable into the model where other parameters are different.
[Alexander Lyubartsev shared the following information today by email.]
DeleteThe individual CH parameters for DMPC from work 2008 are:
beta -0.046 and -0.048
alpha 0.092 and 0.087
I put the Gromacs startup files (gro, top, and an explanation how they were obtained) for simulating a POPC bilayer with CHARMM36 to:
ReplyDeletehttps://dl.dropboxusercontent.com/u/23391062/popc_charmm36.zip
I did submit this to cluster with this *mdp file:
Deletehttps://www.dropbox.com/s/alt4k7ern4tmxk1/mdrunCHARMM.mdp
I made the startup files also for a DPPC bilayer:
Deletehttps://dl.dropboxusercontent.com/u/23391062/dppc_charmm36.zip
I finally have the results for order parameters for POPC simulated with the CHARMM files shared by Markus. The simulation was 30ns long. The area per molecule was essentially unchanged after 10ns having average of 63Ų which is the same that Piggot et al. (dx.doi.org/10.1021/ct3003157) got with the CHARMM force field simulated with Gromacs.
DeleteThe results compared to the order parameters reported by Klauda et al. (http://dx.doi.org/10.1021/jp101759q) for DPPC at 323K are here: https://www.dropbox.com/s/q1aocgfc2xn2i75/DPPCpopcCOMPcharmm.png
There are some differences between POPC and DPPC simulations especially in the alpha and beta. I have already submitted a DPPC simulation at 323K with parameters delivered by Markus to check if I get the same results as Klauda et al. for this one.
Importantly, the order parameters for different hydrogens in alpha and beta are essentially the same which was not clear from the published results (see http://nmrlipids.blogspot.com/2013/09/some-points-concerning-popc-full.html?showComment=1380976610070#c3295821180082482174)
The numerical results for CHARMM POPC simulated with Gromacs at T=303K are here:
1 0.0868119
1 0.0932349
2 0.0187398
2 0.0250516
3 0.248038
3 0.256945
4 0.202941
5 0.196547
5 0.047776
I have had some technical problems with clusters so it took some time to get the results for DPPC bilayer with CHARMM. I did ran 30ns with the files delivered by Markus. The area per molecule did not drift after 5ns so I calculated the order parameters from the last 25ns. The results are here: https://www.dropbox.com/s/q1aocgfc2xn2i75/DPPCpopcCOMPcharmm.png
DeleteI think that the results are now pretty close to the ones reported by Klauda. The simulation is quite short, however. I will run simulation in low hydration with CHARMM parameters. If the model seems to work, then maybe I have to ran some longer simulations as well.
And here are the results as numbers:
Delete1 0.0738207
1 0.0722581
2 0.0251479
2 0.0248203
3 0.251028
3 0.254695
4 0.209637
5 0.1858
5 0.0635338
Hi Samuli, could you provide the signs of these CHARMM36 DPPC order parameters?
Deletehttps://github.com/NMRLipids/nmrlipids.blogspot.fi/blob/master/DPPCcharmm/OrderParametersNEW.dat
DeleteThe results with new script, with signs also from POPC CHARMM36 are in: https://github.com/NMRLipids/nmrlipids.blogspot.fi/blob/master/POPCcharmm/DEHYDRATIONset/OrderParametersNEW.dat
DeleteThis is the short simulations in table 1, which is also used a full hydration result in dehydration study.
Thank you very much for the thorough contribution Patrick. I updated the Figure 1 (using your PME results).
ReplyDeleteI took a closer look at the paper by Poger et al. (http://dx.doi.org/10.1021/ct300675z). If I understand it correctly the have used a plain 1nm cutoff for vdw interactions in simulations with PME but twin range cutoff with 0.8nm and 1.4nm in RF simulations. I think that Patrick had the twin range cutoff in both simulations. This might explain the difference, at least in area per molecules.
ReplyDeleteRegarding the order parameters, Patricks simulation with PME is the first united atom simulation presented here which gives somehow reasonable value for alpha carbon. On the other hand, the glycerol part order parameters are quite low in a similar way as in Slipids. However, I am a little bit confused since it seems that Poger et al. has ended up to a different kind of conclusions and also their results for Kukol and Berger model looks different compared with the results reported in this blog.
I ran a second set of DPPC simulations at 323K with the Poger param with different initial velocities, again one with RF and one with PME (let's call them RF2 and PME2). I sticked to gromacs 4.0.7 to be sure not to get any effect on going to another version.
ReplyDeleteThe S_CD plots for the polar head are here: http://www.dsimb.inserm.fr/~fuchs/project_Samuli/Poger_DPPC/Order_param_Poger_2sims.png. And here are the numbers:
RF2
1 0.00709458
1 0.0278493
2 0.0895108
2 0.0855304
3 0.0849479
3 0.229221
4 0.0947689
5 0.117584
5 0.103398
PME2
1 0.0103783
1 0.0214663
2 0.0835412
2 0.0985141
3 0.10375
3 0.238471
4 0.111633
5 0.11745
5 0.0737633
I find differences in S_CD between simulations with different initial velocities. For some carbon atoms, the variability of S_CD is small (beta carbon for RF and PME, g1 carbon for PME); the variability increases to ~ 0.02 for alpha, g1 et g2 carbons in both RF and PME simulations. Last, carbon g1 shows a big variability (> 0.05) for RF simulations.
Patrick
I am surprised that there is such a large difference between the results with different initial velocities. I have not done exactly same comparison myself. However, for example increasing temperature from 298K to 323K in Berger model changed the order parameters less than changing initial velocities in the Poger model reported by Patrick (see https://www.dropbox.com/s/sa8zeeu7t5tdue4/OPtempCOMP.png).
ReplyDeleteInspired by Patrick's result I did calculate order parameters separately for 100ns sections from 200ns POPC trajectory ran with Berger. The results are here: https://www.dropbox.com/s/gb5wk18k0yn3bzp/POPCbergerFRAMEcomp.png. The largest difference is 0.025 which is larger than I expected.
Despite of this, I still think that the error bars calculated with block averaging are smaller than 0.02. I am not sure if the block averaging underestimates the error in this case.
Since there has been some discussion about the error bars in both, experiments and simulations, I will soon write a blog post to express my understanding how accurate the results are.
I have now ran simulations under low hydration with CHARMM and GAFF force fields by using Gromacs with the setups discussed above. In both simulations the temperature was 323K and the lipid was DPPC.
ReplyDeleteThe simulation with CHARMM was 56ns long, and I used the last 46ns in the analysis. The system stays in the liquid phase and seems to equilibrate pretty fast.
The simulation with GAFF was 101ns long and the last 61ns was used in the analysis. The system transformed to the gel phase during the first 20ns.
The headgroup and glycerol order parameters from these simulations are shown here:
https://www.dropbox.com/s/w1rnc7jku6nmn0r/OrderParameterDEHYD2.png
together with the Berger and experimental results from the manuscript. I did also add some deuterium NMR results to the plot.
As a fast conclusion, I would say that the response of CHARMM to the dehydration is qualitatively similar to the experiments. With the GAFF this does not seem to be the case for the beta and g2 carbons.
The issue is complicated by the phase behaviour. After running the simulations I realized that for DPPC there is a phase coexistence between liquid and gel phases with the used conditions (T=323K, 7 water molecules per PC) http://dx.doi.org/10.1021/bi00645a014. So, regarding the phase transition in these simulations one cannot tell if CHARMM of GAFF is better. I think that I will run a POPC simulation with GAFF in low hydration to see the behaviour with dehydration in liquid phase.
Promising result with CHARMM makes the CHARMM results with ions even more interesting. If anyone is willing to share the results from CHARMM simulations with ions or even share the initial structures and/or force fields that would be a great help.
I have now calculated the order parameters as a function of dehydration also for GAFF POPC model. Opposite to the DPPC model it did not go to the gel phase in low hydration. The order parameters are calculated over 50ns from equilibrated trajectories. The results are included now in the figure with other dehydration results:
Deletehttps://www.dropbox.com/s/szzb0m99jkqvyks/OrderParameterDEHYD4.png
In contrast to the experiments, there seems to be mild increase in beta with dehydration.
I will wait the results for lipid14 before further considering GAFFlipids.
Since I need equilibrated membranes (with and without cholesterol) for my project, I would like to share some results I obtained recently.
ReplyDeleteI'm using the charmm36 lipids forcefield with gromacs 4.5.7.
Files was downloaded here (http://www.gromacs.org/@api/deki/files/184/=charmm36.ff_4.5.4_ref.tgz, from Piggot et al., 2012, JCTC).
I ran simulations of 128 POPC and 128 DOPC (no ions, ~40 H20 molecules/lipid, 303K, TIPS3P).
Starting structures was taken from here (http://people.su.se/~jjm/Stockholm_Lipids/Downloads.html).
After equilibration, 150ns was performed for both simulations.
The first 50ns was discarded for the order parameter calculation.
Area per lipid and order parameter of the acyl chains were the same as reported by Piggot et al.
I ran also one simulation of 100POPC/24 Cholesterol (roughly ~20% of cholesterol) with the same parameters as above.
Parameter files for cholesterol was taken from here (http://dx.doi.org/10.1021/jp207925m) and converted into gromacs files.
(SPE calculations was done to assess the conversion).
Membrane was built with the charmm-gui interface.
Right now, 135ns has been performed and the calculation was done on the last 35ns.
Of course, I can provide all mdp, itp and gro files that I used.
You can find results from these 3 simulations here (+ data obtained by Samuli with POPC & charmm36) :
https://www.dropbox.com/s/gta36ptwra8xsy3/order_HG.png
And here are the numbers:
#for POPC
1 0.0803443
1 0.0798408
2 0.0272208
2 0.0252511
3 0.244336
3 0.252601
4 0.214783
5 0.189221
5 0.0435286
#for DOPC
1 0.0821802
1 0.0829807
2 0.0285146
2 0.0269431
3 0.235605
3 0.250825
4 0.192396
5 0.169747
5 0.064338
#for POPC+20%Chol
1 0.0807474
1 0.0850853
2 0.106129
2 0.105879
3 0.233221
3 0.241422
4 0.236271
5 0.207753
5 0.0430222
Both of our simulations (of POPC) agreed well. The slight differences found on g2 and g1 could be due to a lack of sampling: I have also minor differences if I launch calculations from the last 30ns or 100ns. For DOPC, the "major" changes are located on the g2 and g1 atoms.
The results from POPC-20%Chol are interested. For atoms Beta, g3 and g2, simulations agreed with your experiments (at least, on the relative differences). But for the alpha atom, I have a big gap, compared to the pure POPC and experiment, which I don't explain...
To be thorough, I plan to launch a second simulation with different velocities.
I also plan to perform new simulations with different percentages of cholesterol.
I'll let you know.
Cheers,
Hubert
Thanks for the contribution!
DeleteI did add your results into the figure 5 in the manuscript:
https://www.dropbox.com/s/9aj8nzfpu4i5eiv/OrderParameterCHOL2.png
Indeed, it seems that the CHARMM model predicts significantly larger influence of cholesterol on the alpha carbon than measured by the experiments. Also the influence on g2 might be too large but it is hard to say without a point with larger concentrations.
The largest difference between your and my results for POPC is 0.013. This less than 0.02 which I have considered to be the accuracy of the values. My simulation was only 30ns long and 25ns was used for analysis. I agree that the difference is from statistics. How large difference did you got when you analyzed only the last 30ns?
You're welcome!
DeleteTo be thorough, I launch several analysis, on my POPC simulation, with different length times (10 to 90ns) with as reference 100ns length (which correspond to the values I gave you).
This is valid for 128 lipids, larger patchs could need less.
Here the results :
--------------------------------------------------
Length | Difference < min-max >
--------------------------------------------------
10ns | <0.0017-0.0378>
20ns | <0.0036-0.0228>
30ns | <0.0003-0.0223>
40ns | <0.0002-0.0208>
50ns | <0.0001-0.0185>
60ns | <0.0003-0.0110>
70ns | <0.0000-0.0076>
80ns | <0.0003-0.0036>
90ns | <0.0000-0.0029>
It seems that ~50ns of calculation on a equlibrated membrane (at least on my simulation) are needed to go below the threshold of 0.02. But, with 80ns, I gain a 10-fold precision compared to 10ns.
Overall, calculations on the Beta, alpha and g2 atoms are always below the threshold (even with 10ns). The most sensitive calculations are on the 2nd hydrogen of g1 and g3 atoms.
Hi,
DeleteHere the values corrected with the new script. They are pretty much the same except for the alpha carbon which are better values according to experimental (I don't where it came from, I checked the old script twice and ran it on 2 independant simulations)
I also add values for a simulation with 50% Cholesterol (80 POPC, 80 CHL, 100ns, same parameters than the others).
You can find a plot here: https://www.dropbox.com/s/aziebnj4j7bq3mf/order-HG_POPC-Chol.png
And the values (with the sign):
#POPC
1 -0.0803443
1 -0.0798408
2 0.0272208
2 0.0252511
3 -0.244336
3 -0.252601
4 -0.214783
5 -0.189221
5 -0.0435286
#POPC + 20% Chol
1 -0.0789494
1 -0.0824184
2 0.0348449
2 0.0228575
3 -0.237606
3 -0.249519
4 -0.233063
5 -0.205022
5 -0.0597419
#POPC + 50% Chol
1 -0.0570045
1 -0.0611228
2 0.0348208
2 0.0292669
3 -0.175534
3 -0.194927
4 -0.222679
5 -0.182571
5 -0.0114098
Just out: Our current knowledge concerning the full hydration behaviour gathered into a single plot.
ReplyDeletehttp://figshare.com/articles/comparison_pdf/904933
I shall write a full descriptive blog post on this, but thought that it might be fun to see right now for everyone who has contributed.
Here's some results for the MacRog force field with varying cholesterol concentration (0,5,10,20 mol-%). The lipid is PPPC (16:1,16:0), simulation time 100 ns (last 50 used for analysis), 45 waters/lipid, 150mM NaCl. The data is generated for other purposes so the lipid is not the same etc.. However, PPPC should behave pretty much like POPC.
ReplyDelete0% Cholesterol
1 0.0016 0.0187
2 0.0371 0.0308
3 0.1413 0.2426
4 0.2064
5 0.0067 0.1718
5% Cholesterol
1 0.0053 0.0222
2 0.0393 0.0269
3 0.1361 0.2401
4 0.2059
5 0.1724 0.0092
10% Cholesterol
1 0.0114 0.0153
2 0.0340 0.0177
3 0.1217 0.2528
4 0.2291
5 0.1784 0.0244
20% Cholesterol
1 0.0077 0.0097
2 0.0282 0.0227
3 0.1186 0.2467
4 0.2196
5 0.1730 0.0225
All in all, the changes seem fairly small yet there is some effect. If the MacRog performs well with respect to ion concentration and dehydration (results should be ready soon), I will do a systematic evaluation of the effect of cholesterol concentration in a POPC bilayer without salt and with cholesterol concentration going to much larger values than in these simulations.
I included your results into the figure with cholesterol results:
Deletehttps://www.dropbox.com/s/9aj8nzfpu4i5eiv/OrderParameterCHOL2.png
The simulation results for alpha and beta in PPPC with 0 CHOL% are slightly different and farther from experimental points compared with POPC reported earlier with this force field.
Compared to the CHARMM results by Hubert, the alpha seems to behave better in MacRog model as a function of cholesterol. However, in the MacRog model the other order parameter for g3 carbon seems to be clearly too small.
Indeed, it seems that generally cholesterol has very modest effect, as it should be based on experiments. However, in Berger model the effects were also very modest below 30% of CHOL. Thus, I also think that the simulations with larger concentrations are needed to confirm this but I agree that it is better to check the other results first.
Joona (Tynkkynen) made the systematical analysis of the effect of NaCl concentration on the MacRog model and here are the results.
ReplyDeleteSimulation details: POPC, ~50 waters/lipid, PME, simulated for 120ns, last 50ns used for analysis.
0 mM
1 0.0050 0.0396
2 0.0577 0.0344
3 0.1352 0.2417
4 0.2017
5 0.1626 0.0175
100 mM
1 0.0236 0.0180
2 0.0407 0.0131
3 0.1218 0.2465
4 0.2112
5 0.1673 0.0095
200 mM
1 0.0070 0.0265
2 0.0046 0.0106
3 0.1121 0.2532
4 0.2279
5 0.1814 0.0239
300 mM
1 0.0355 0.0108
2 0.0061 0.0042
3 0.1190 0.2504
4 0.2269
5 0.1922 0.0117
400 mM
1 0.0214 0.0099
2 0.0099 0.0071
3 0.1240 0.2535
4 0.2291
5 0.1821 0.0253
I also made the plots, available here:
https://dl.dropboxusercontent.com/u/6808285/ions_macrog.pdf
The results look pretty nice to me, there's no drastic changes with salt concentration as in Berger at least.
Results on the effect of dehydration should land here in a matter of days.
Great! This 0-mM-run is apparently independent from the one Matti posted results of on Sep 20th 2013? (That had 44 waters/lipid.)
DeleteIf so, I could add these to the full hydration plot. What was the temperature?
It's not the same simulation yet the simulation parameters are identical. The only difference should be the number of waters. The temperature was 310K. This temperature was also used in the PPPC/chol simulations reported above.
DeleteI added your results to the manuscript figure 4 a):
Deletehttps://www.dropbox.com/s/9jmn2j2kkmejv8t/OrderParameterIONSnacl2.png
Note that I removed the experimental data for g1 and g2 as a function of ion concentration, see this comment:
http://nmrlipids.blogspot.com/2013/09/some-points-concerning-ion-membrane.html?showComment=1390480835857#c5773262305022240320
Since the results for bilayer without ions are now significantly closer to the experimental values, it is reasonable to plot the order parameters as a function of ion concentrations with the same scale which is used to determine the ion partition coefficients into a bilayer as done, for example, by Akutsu and Seelig, Biochemistry, 20, 7366 (1981). The plot is here:
https://www.dropbox.com/s/qysnm1ux16d4jf0/OrderParameterIONSexpMACROG.pdf
Problem in this force field seems to be that it gives systemically different order parameters for different hydrogens in alpha and beta carbons. For me it looks like that the CHARMM is the only force field not having this problem.
Otherwise the response of alpha to the NaCl seems to be qualitatively similar to the CaCl_2 in the experiments but even stronger. By a rough comparison to the Fig. 4 in the paper by Akutsu and Seelig, it looks like that the response might be close to the LaCl_3 response in experiments. This would be the case especially if the order parameters with 300mM and 400mM would be positive in the simulations. Is this the case? Anyway, the alpha response would indicate that the partition of Na into a bilayer is too high in this force field as well. Have you checked the density plots?
The changes in beta are smaller in simulations and experiments which makes it harder to interpret.
The NaCl seems to have some effect also on g2 in your results. As I mentioned in the comment linked above, there is not explicit measurement for this but I find it unlikely that ions (especially monovalent) would change the g2 order parameter.
I calculated the density plots and they're available here:
Deletehttps://dl.dropboxusercontent.com/u/6808285/ions.pdf
So indeed the sodium ions do partition to the membrane.
Thanks for the density plots! Would it be possible to have those in data format for replotting? That might become useful in future.
DeleteHere you go.
Deletehttps://dl.dropboxusercontent.com/u/6808285/ions_data.zip
And here is the behaviour of the MacRog model for dehydration, parameters are the same as with varying salt concentration.
ReplyDelete50 waters / lipid
1 0.0404
1 0.0044
2 0.0588
2 0.0330
3 0.2443
3 0.1358
4 0.2046
5 0.1651
5 0.0177
25 waters/lipid
1 0.0362
1 0.0033
2 0.0520
2 0.0331
3 0.2413
3 0.1245
4 0.2091
5 0.1609
5 0.0118
20 waters/lipid
1 0.0345
1 0.0161
2 0.0545
2 0.0417
3 0.2448
3 0.1606
4 0.2024
5 0.1692
5 0.0086
15 waters/lipid
1 0.0486
1 0.0190
2 0.0659
2 0.0459
3 0.2461
3 0.1553
4 0.2016
5 0.1696
5 0.0131
10 waters/lipid
1 0.0559
1 0.0516
2 0.0755
2 0.0717
3 0.2598
3 0.1972
4 0.2050
5 0.1815
5 0.0108
5 waters/lipid
1 0.0929
1 0.0713
2 0.1150
2 0.0864
3 0.2505
3 0.1958
4 0.1851
5 0.1596
5 0.0032
And here's a plot I made
Deletehttps://dl.dropboxusercontent.com/u/6808285/waters_macrog.pdf
Obviously the match is poor. The parameters for the head group were derived in explicit solvent yet there's a model in which vacuum was employed during the derivation. This could behave better with less hydration.
I added your results to the plot with other force fields: https://www.dropbox.com/s/6q4oszxuaavuea5/OrderParameterDEHYD3.png
DeleteI would say that the match to the experiments in clearly poor only in the beta carbon. The alpha, for example, is very good. I would say that this is in line with your ion results, where the response of the aplha on the penetrating charge was similar to the experiments (there was too much incorporation, though), while the response of the beta was not clear.
Matti mentioned above that you have some parameters derived also in vacuum. Are you going to test those for dehydration? It would be very useful to know if those would improve the results.
DeleteSure, I'll do this asap.
DeleteSo I calculated the effect of dehydration with the MacRog force field parametrised in vacuum for systems with 5 and 10 waters/lipid. I updated the neighbour list every 10 steps in order to speed things up. Joona updated this list every step which slows down the simulation by a factor of ~5. I ran for 80 ns and employed the last 50 ns for analysis.
DeleteThe behaviour is only slightly different to the model parametrised in implicit solvent and does not solve the issues related to response to dehydration
The results are as follows:
5 waters/lipid
1 0.0550
1 0.0928
2 0.0702
2 0.1026
3 0.2036
3 0.2213
4 0.1720
5 0.0165
5 0.1857
10 waters/lipid
1 0.0624
1 0.0664
2 0.0766
2 0.0847
3 0.2232
3 0.2493
4 0.2023
5 0.0235
5 0.1774
I added these results to the dehydration plot (labeled MacRog2):
Deletehttps://www.dropbox.com/s/szzb0m99jkqvyks/OrderParameterDEHYD4.png
It seems that the results are changing a bit, but maybe not the better direction, especially due to forking.
I'm not much of an expert on force field development and to me it seems that many of the choices made in most of the lipid FFs are rather arbitrary. I decided to take a reductionist view trying to understand the effect of each force field parameter to the order parameters and modified the parts of Berger lipids that I believed might have an effect
ReplyDeleteThe results of some simulations I ran are summarized in this pdf and the figures therein:
http://amlrg.kapsi.fi/nmr/ex.pdf
For my take on the plots, keep reading.
The first exhibit: All head group dihedrals removed. The splitting disappears, and magically all the values are closer to experiments (save g1, which does have a split in Ferreira et al.). Now this is not as good as rosy as it sounds: the simulations were run in NPT and indeed the area per lipid was also affected: a reduction of some 10%.
Exhibit 2: The strongest dihedral added back. This is the CCCO improper dihedral at the junction of the tails that aims to keep a structure of some sort (whatever a 35.264 degree dihedral angle corresponds to). Because the energy constant of this parameter is so high (334.7 in Gromacs units where most dihedrals are ~3), I suppose this is an experimental/quantum result that ought to have a physical basis. I am no chemist, so I don't quite understand where these numbers come from, any ideas? Neither CHARMM nor GAFF have an explicit dihedral of this type. In any case, this results in the splitting of all order parameters it directly influences, namely g1 and g3.
Exhibit 3: The second strongest dihedral added back. Turning the previous improper dihedral off for just a moment, I turned on the second strongest dihedrals (constant value 16.74). These are the ones that originate from the g1 and g2 carbons down their respective chains. g1 and g3 order parameters are affected, but curiously no splitting occurs.
Exhibit 4 is the combination of the previous two, i.e. the dihedrals described in the previous two exhibits are turned on. The result is rather unsurprising, essentially the combination of the two.
Finally, for exhibit 5, I took the case of exhibit 3 and enabled one more dihedral that has the g1 and g2 carbons and the first oxygens in their respective tails. I wanted to see if this would result in order parameter splitting. It does, but very little. Most obvious effect is to move g2 closer to the experimental results.
For the order parameter data see
http://amlrg.kapsi.fi/nmr/
I've also uploaded the modified popc.itp files, so you can test for yourselves. The simulations here were ran with a 4 fs time step and only 64 lipids + 2000 water (i.e. should still be fully hydrated). 10 equilibration + 50 ns for actual analysis. It might be useful to test the parameters with a larger system.
As has been pointed out earlier in this blog, another option would be to play around with partial charges and/or 1,4 interactions. It might also be of interest to see how these behave under different hydration/salt conditions.
tl;dr
Disabling head group dihedrals rids the splitting of the order parameters, and turning them on selectively where needed one can obtain an improved Berger force field as far as the order parameters are concerned. What is still unclear is which exact dihedrals are responsible for the splitting in the Berger model, and if g1 and g3 can be split separately.
The Amber Lipid14 force field was recently published, paper available at:
ReplyDeletehttp://pubs.acs.org/doi/pdf/10.1021/ct4010307
However, they don't report the HG order parameters in the paper and these could be checked.
Thanks for pointing this out. I think that we should definitely calculate the HG and glycerol order parameters. I was trying to look if I could generate the Gromacs input files by following the procedure reported previously by Marius Retegan https://github.com/mretegan/GAFFLipids2Gromacs. However, since I do not have any experience on Amber, it was not clear for me if the lipid14.dat file provided in the supplementary material of the paper is enough to make the procedure or how it should be done in practise. It would be very heplful if someone with more experience on this would help.
DeleteI've created another repository containing the converted Lipid14 parameters for POPC. This time I've also compared the energy terms obtained with the two programs, Amber and Gromacs.
Deletehttps://github.com/mretegan/Lipid14toGromacs
Thanks to Marius for convertion! I have constructed a starting structure for a bilayer with 72 POPC lipids and ran it 100ns. I analyzed the last 50ns which seemed to be in equilibrium. This time I got area per molecule of ~66 Ų being in a good agreement with the value 65.6 reported in the Lipid14 paper. The order parameters for the headgroup and glycerol from Lipid14, GAFFlipid and experiments are here: https://www.dropbox.com/s/no09z01v5dicpmp/compTOgaffEXP.png
DeleteI would say that the results are not getting better with Lipid14.
The end structure and files I used for simulation are here: https://www.dropbox.com/s/yzzx8alvtfbtf0d/LIPID14files.tar
PART 1/2
ReplyDeleteThis week I ran a bunch of simulations (32 lipids per monolayer, each spanning 60 ns of which 50 ns was used for analysis, about 30 waters per lipid) with randomized head group dihedrals. I am providing the data here in hopes that someone might fit a neural network or some other, more advanced machine learning algorithm to these to find correlations and patterns between the force field parameters and the resulting order parameters.
For the raw data arranged in a way that it can be readily analysed by some algorithm, see params.dat (dihedrals) and op.dat (order parameters) found at http://amlrg.kapsi.fi/nmr. Error as STD from 10 ns blocks should be smaller than 0.01 (I did not calculate this for all data, but a select few runs). Each row corresponds to a simulation. If you want to understand what the parameters mean and how they are defined, see pprand.sh (the code itself modifies the listed energies E to abs(1+R)*E, where R is a random number drawn from the normal distribution). The randomized data is centered around different points that I picked to be good guesses to sample around after some data, so not evenly distributed in all space. I still have the raw trajectory data for now, so please ask if you want something analyzed. It's roughly a terabyte's worth, so I'll probably have to delete it at some point in the near future.
To my understanding it is not possible to get any clues as to which order parameter in g1 is high, and which one is low from experiments but then again I don't know much about the setups. A problematic feature immediately apparent from the data is the fact that the splitting can easily reverse as one modifies the force field. I propose that the plotting of the order parameter g1 be redefined, so that we could classify the nature of the splitting for all the force fields. My analysis of the data seems to suggests that Berger ought to split in the opposite way of how it currently does to better fit the experimental order parameters. This is strange as from what I can see, CHARMM splits in the same direction as Berger (I don't know how the scripts are used for CHARMM, and if the naming conventions remain unchanged). I should also mention that in the data I generated the opposite split is slightly more common than the standard split. The same applies for all the other order parameters. Experimentally there should not be a split, but determining which direction the split occurs in simulations might give some insights.
How I analysed the the data was very simply to run naive linear regression (expanding around some point in parameter space) and surprisingly found rather strong correlations. Trying to solve the inverse problem, i.e. from order parameters to dihedral parameters is, not surprisingly, more difficult, and the correlation is not as strong. This method of analysis lead me to predict new dihedral parameters (popcBergerYver1.itp), which I subsequently tested, and got the following order parameters (plot: http://amlrg.kapsi.fi/nmr/bergeryver1.png):
1 0.0542851
1 0.0453979
2 0.0472485
2 0.0728669
3 0.219549
3 0.223053
4 0.205448
5 0.0134943
5 0.14968
I should mention that I did not try to make the dihedral parameters smaller, but rather my minimization procedure suggested that several should be (essentially) zero, in line with my previous post on this blog. I also ran simulations at higher salt concentrations and the effect was a slight lowering of the alpha and beta order parameters (similar to MacRog alpha). Now this should not happen, which suggests that some work remains to be done.
PART 2/2 (because there is a restriction on length of comments)
DeleteNow naturally there are many sets of dihedral parameters that the linear model (or any other) predicts should match the experimental data, and one could try evaluating other sets, too. The estimates for dihedral parameters could also be further improved by more advanced nonlinear methods (see the first paragraph).
Anyway, it'd be nice if someone could maybe test the parameters provided above at different hydration levels or salt conditions etc to more fully understand the current shortcomings. Also, results from larger bilayers in general would be useful to see. If the parameters fails these tests, then I suppose it might not just be the dihedral parameters that need to be changed, but the partial charges as well. At least these can be more or less guessed from quantum data (and there has been a lot of new data generated since the time of Berger, I am sure). Or one could take another set predicted by the model above. In any case, any extra data would help us develop the force field into a better direction.
tl;dr
I provide a large dataset of dihedral parameters -> order parameters for the Berger lipids. I use the data to predict a new set of parameters. These turn out to be better performing than standard Berger, at least in fully hydrated bilayers. Testing in other conditions is naturally very important.
This is very interesting. Couple of quick questions and comments.
Delete1) Before deleting the trajectories, it might be good to consider option to put those publicly available to figshare.com (unlimited public space)
2) For me it seems that the results you show for the fully hydrated case can be considered to be in very good agreement with experiments, except the splitting in the alpha carbon. Do you think that it would be possible to fix even this with more sophisticated algorithms or some other way inside this analysis? I am really not expert in this kind of analysis.
3) You mention some test with ions. Which ions and how much did you use? Could you share these results as well?
4) I will try the suggested parameters at least for larger bilayer patch and with low water content.
1) Sounds interesting, I will look into this. They seem to have a limit of 250 megabytes per file, so I would have to cut the trajectories into small pieces. This might make things inconvenient.
Delete2&3) I am almost sure that you can get rid of the split, and that more advanced methodologies would suggest better parameter sets. See for example simulation number 208 (which was generated by random sampling around the force field that I eventually chose to suggest):
1 0.0449828
1 0.0339947
2 0.0517723
2 0.0570385
3 0.215114
3 0.217793
4 0.213845
5 0.0620523
5 0.14682
Here the split in g1 is too small, but I would expect there to exist parameter sets, where both splits can be made to work well. If you look at the .sh file that generates the force fields, you'll see that I have assumed that some of the dihedrals should have the same values. I did this to make the parameter space smaller, and because these dihedrals are nearly, or completely, symmetric.
I said that I concentrated on certain areas of the phase space. After 128 initial simulations (base set), I ran somewhere between 20 and 30 simulations sampled randomly around two different sets of parameters (generating data sets 1 and 2) suggested by my linear analysis. As I recall, data set 1 performed better, and I made a new prediction from it, and again ran a couple dozen of simulations around this point (data set 3). I predicted one further set of parameters, but these did not perform so well. So the BergerYver1.itp is the base parameter set of data set 3. Thus if you plot the rms error between the order parameters from the simulations and the experimental ones, you'll se a couple of larger jumps where I made the sampling around a different point (the .dat files are arranged chronologically). Note that with this kind of strategy it is quite likely that I might get stuck in local minima, and this is where better methods would come in handy.
What is more difficult is, based on the data that I provided, to ensure that the force field behaves well under different conditions. I ran the BergerYver1.itp in the POPCions/POPCnacl setup in the file bundle that you provided, so maybe 200 mmol (and a larger bilayer). Here are the order parameters I got:
1 0.0108742
1 0.0110787
2 0.00812195
2 0.0247528
3 0.270311
3 0.243236
4 0.227569
5 0.00319724
5 0.198898
So you'll notice that they don't quite behave the way that they should: The g1 split grows too large and the alpha and beta values become too small. It is of course possible that one do a large set of simulations under salt conditions (and/or dehydration) and again try to find parameters that would fit all data. If I have the time, this is what I will try next.
Just a short addendum: The BergerYver1.itp is line number 190 in the .dat files, and lines 190 < n <= 220 are force fields generated around this point. This should be more or less obvious if you just compare the rms distances of the dihedrals.
DeleteConcerning the 250Mb file size limit on FigShare. You might want to check out zenodo, which is hosted by CERN. Seems that their file size limit is 2 Gb:
Deletehttp://zenodo.org/faq
I think it would be very nice to keep your data set around for future testing and algorithm development.
I have now tested the model by Antti Lamberg for
Deletea larger system:
https://www.dropbox.com/s/1v1nh7ap2crbiq7/LARGERsystem.png
and in dehydrated conditions:
https://www.dropbox.com/s/szzb0m99jkqvyks/OrderParameterDEHYD4.png
I did also put the order parameters with NaCl reported by Antti into the same figure with other results:
https://www.dropbox.com/s/9jmn2j2kkmejv8t/OrderParameterIONSnacl2.png
I would say that the system size did not have much effect. The responses are quite similar to the Berger, even though the absolute values of the order parameters fully hydrated and pure lipid bilayer are better.
However, while doing this I realized something very important. I said previously that the signs of the order parameters of Berger are correct:
http://nmrlipids.blogspot.com/2013/09/the-manuscript-is-now-available-what.html?showComment=1379073126833#c6264805277458030509
Now I have realized that I was wrong. Experimentally the signs are following:
beta: -
alpha: +
g1-g3: -
For the order parameters from Antti's model the signs are the following:
beta 0.0497808
beta 0.0364245
alpha 0.043142
alpha 0.081317
g3 -0.219468
g3 -0.218196
g2 -0.195602
g1 0.055947
g1 0.148023
which are the same as in Berger. Thus the signs of beta and g1 seems to be wrong. The reason might that because of my previous comment Antti thought that the signs are correct in Berger. Anyway, I think that the project is in the state that we have start taking the signs into account instead of the absolute values. I will write a blog post about this ASAP. Sorry for the confusion.
Antti raised a question above that do we know from experiments which one of the g1 hydogens has the lower order parameter (close to zero), and which one has the larger? I have been now reading some literature more carefully with this question in my mind and I realised that Gally et al. (http://dx.doi.org/10.1021/bi00510a017) have been able to label the hydrogens stereospecifically for PG and PE lipids in E. Coli. They say that the g1S hydrogen has the order parameter close to zero, while g1R hydrogen has the larger order parameter.
DeleteSince the glycerol backbone structure seems to same for all phosholipids (as discussed, e.g., by Gally et al. and in the accuracy post), I think that it is reasonable to assume that PC lipids has the same stereospecificity.
To use this information in this project we still have to figure out which carbon in the force fields is R and which is S. It is not obvious for me but I think that for some people it would be.
Part 2/2
Delete3) Experimental values for g1 in R or S configuration
In the paper from Gally et al (http://dx.doi.org/10.1021/bi00510a017), it's said that (1S)-[1-2H]PE gives a quadrupolar splitting of ~ 0 kHz. According to what I said above, g1 in a S configuration is obtained by deuterating H322 -> D322. Thus we can say that:
- D322 -> g1 S -> should give a QS of ~ 0 kHz --> this gives |S_CD| ~ 0
- D321 -> g1 R -> should give a QS of ~ 17.6 kHz --> this gives |S_CD| ~ 0.14
Note that these QS values were measured for PE and close values were found for PG (QS of 14.4 kHz -> |S_CD| ~ 0.11) in the same paper. These authors assume the two QS are split in the same way for PG and PE (they didn't label stereospecifically one g1 H for PG as they did for PE, they labeled with two deuterons at the same time). Warschawski & Devaux measured S_CD for g1 on POPC and DOPC (http://link.springer.com/article/10.1007%2Fs00249-005-0482-z). They find two QS for g1 and only comment the highest one (|S_CD| ~ 0.11-0.12) but do not precise whether g1 is in R configuration. In Aussenac et al. (http://dx.doi.org/10.1021/la034268q), the experiments on DPPC report |S_CD| ~ 0.10 for g1R and |S_CD| ~ 0 g1 S.
These experimental results seem to go in the same direction, thus I shall say that whatever the polar head we can assume:
- the large QS comes from g1 R (corresponding to D321 in the DPPC described above)
- the (almost) 0 QS comes from g1 S (corresponding to D322 in the DPPC described above)
4) What about g3?
Gally et al. labeled stereospecifically g3 as well. They found very close values for both deuteration:
- ~ 25 kHz for g3 R -> this gives |S_CD| ~ 0.20
- ~ 27 kHz for g3 S -> this gives |S_CD| ~ 0.21
If I take the DPPC described above and apply the rules to find the carbon configuration, we get:
- D121 -> g3 R
- D122 -> g3 S
I might have to read again Samuli's post on accuracy, but I shall say that the difference doesn't look significant and we can consider that the two H are (almost) equivalent. Thus a good force field should not split too much the two H!
5) Two last thoughts
- If you want I can do the same thing for POPC (in this case Samuli could you please send me a gro or pdb of one protonated POPC?).
- All the contributors might have to update the values for g1 with saying which deuteron gives which QS
Thanks for the nice explanation!
Delete1) - 2) I followed your instructions and labeled the g1 and g3 hydrogens for Berger, CHARMM and GAFF force fields. I got the following results:
g1:
Berger:
H321 -> R
H322 -> S
CHARMM:
HX -> R
HY -> S
GAFF:
H1 -> R
H2 ->S
g3:
Berger:
H121 -> R
H122 -> S
CHARMM:
HB -> R
HA -> S
GAFF:
H5 -> R
H4 -> S
I used the structure files which can be found here:
https://www.dropbox.com/s/ygtht30ncjb7lv2/singlemolBERGER.gro
https://www.dropbox.com/s/0zzvxpd3tl76stn/singlemolCHARMM.gro
https://www.dropbox.com/s/j54ck4qbpwp6edf/singlemolGAFF.gro
It would be nice that someone would check that I have not done any mistakes.
I also made a new plot comparing the results:
https://www.dropbox.com/s/owxg0vow9lv24ng/HGorderparameters2.pdf
I made the labeling for the MacRog by using the files in the supplementary material of the publication (http://dx.doi.org/10.1021/jp5016627), and assuming that the reported values were in the same order as the hydrogens in the delivered *gro file. I think that these results should be confirmed by the people who has shared the MacRog results.
The experimental numbers are from Ferreira et al. (http://dx.doi.org/10.1039/C2CP42738A), but the R/S labeling is taken from Gally et al. (http://dx.doi.org/10.1021/bi00510a017)
I think that when the signs and R/S labeling is taken into account, the CHARMM model is clearly closest to the experiments.
3) Aussenac et al. indeed label the R and S in their results. However, I do not understand how they have done the experiment for the labeling (as I do not undertand how they measure the signs). Anyway, this is not that critical in the labeling case since the labels agree with Gally et al.
4) I think that the small forking of g3 has been systemically detected in the measurements with large enough resolution, and it has been actually used to build molecular models for the headgroup and glycerol (http://dx.doi.org/10.1021/bi953083i, see also http://nmrlipids.blogspot.fi/2013/09/some-points-concerning-popc-full.html). Thus, in principle, a perfect model would get this right. However, I think that there are still other things to consider before this detail could be tackled with MD models.
5)
-It would be nice if you could check the labelings I did above
-My opinion is that we do not necessary need these results for all the force fields reported by this far. I think that it would be enough to have the results for the models which are still under discussion. This is because the goal of the project was to find a good force field for this region and the ones which were found to be less good are not getting better by taking the R/S labeling into account.
1) -
Delete2) I checked your assignment on Berger, CHARMM and GAFF for
g1 & g3 carbons and I agree.
3) Indeed for the paper by Aussenac,it's said in the appendix that the assignement correspond to that from Gally et al, so we are safe!
For the signs, I could discuss with an expert in 2H solid state NMR last week. From what I understood, it's impossible to get the sign directly from a 2H experiment. Instead, one has to use a model of motion which is taken in the Aussenac paper from other refs (see the sentence: "A general method for evaluating separately Smol and (3cos2 gamma_i-1)/2 in eq 2 has been proposed.15,26,38") and explained a bit in the appendix. I don't understand the details, but I can easily imagine that if you assume a given motion and you have a mathematical model for it, it should be doable to get the sign. I realize it might not be the good place to discuss this. Shall I put a link to here in the post about the signs?
4) -
5) -
6) One last thing (I promise!). As I said above, Warschawski & Devaux measured S_CD on the polar head of POPC and DOPC (http://link.springer.com/article/10.1007%2Fs00249-005-0482-z). This is another source of experimental data which can be useful to us! Especially, their Figure 2 compares POPC/DOPC and DPPC taken from other papers.
The hydrogen atom naming in the DPPC files supplemented by the MacRog paper was different to the one used in the POPC structure I used and therefore they are inverted in the new plot which plots S and R separately. However, the correct assignment should be:
Deleteg3:
H1F: S (-0.23)
H2F: R (-0.14)
g1:
H321: R (-0.16)
H322: S (+0.01)
This is reply to the above comment by Patrick.
Delete3) Thanks! I did not read the appendix carefully enough. I have now updated the post about the signs of the order parameters.
6) Thanks for pointing out the paper. Warschawski et al. seems to get somewhat lower order parameter values compared to the values reported in other papers. They say that 13C NMR gives systemically lower values than 2H NMR. However, I think that the difference is not significant if the 13C NMR measurements by Gross et al., dvinkskikh et al. and Ferreira et al. are compared to the 2H NMR experiments. There is another paper which also gives somewhat lower order parameters (Hong et. al. http://dx.doi.org/10.1016/S0006-3495%2895%2980064-0). However, Hong et al. also report relatively large error bars arising from the measured spectra. For me it seems that there might be some inaccuracy also in the results by Warschawski et al.: the signal to noise ratio for some carbons is quite low (supplementary material) and, to my understanding, the numerical line shape simulations are not used to calculate the dipolar couplings. In any case these publications has to be taken into account for the accuracy discussion. However, it remains to be decided if these values should be given less weight due to higher error bars.
Here comes the Ulmschneider&Ulmschneider values, I ran the system available in Lipidbook (128 POPC+26 W/lipid) for 100 ns and analyzed the last 50 ns. I tried to set all parameters to match the ones they used yet I was not sure whether they used the dispersion correction (DC) or not. Therefore I ran the simulation with and without the 'EnerPres' option in GROMACS. The area differs somewhat, I get 0.635 and 0.654 with and without DC, respectively. However, the head group order parameters are not affected much.
ReplyDeleteAnyway, the results (a plot can be found here: https://dl.dropboxusercontent.com/u/6808285/order_ulm.pdf)
no DC:
1 0.0647
1 0.0601
2 0.0332
2 0.0599
3 0.2911
3 0.2932
4 0.3176
5 0.1450
5 0.2767
DC:
1 0.0703
1 0.0694
2 0.0319
2 0.0508
3 0.2965
3 0.3037
4 0.3225
5 0.1373
5 0.2831
The signs for the Ulmschneider results are:
Delete-,-
+,+
-,-
-
+,- (the larger value has a minus sign)
These are the same for simulations with and without dc.
Hi,
ReplyDeleteWe have a new lipid force field currently under development. The parameters are not yet publicly available but here are some preliminary order parameter results.
Here are results with DPPC at 323K in full hydration without any salt and with 150 mM NaCl. Simulations were performed with Gromacs version 4.6.1, they were 100 ns long with the whole trajectory analyzed.
carbon | Pure DPPC | DPPC with 150mM NaCl
beta 0,044009 0,03932
beta 0,035899 0,035869
alpha 0,061717 0,083775
alpha 0,077656 0,086653
g3 0,229328 0,236369
g3 0,267008 0,28263
g2 0,283727 0,278748
g1 0,032486 0,035102
g1 0,115361 0,096466
https://www.dropbox.com/s/5n5nq5fjck4ev4a/DPPC_NaCl_Orange_323K.png
Samuli also kindly checked the behavior of the new force field with respect to different conditions. He will post some results shortly.
Cheers,
Jukka Määttä & Luca Monticelli
Thanks for the contribution!
DeleteIndeed Jukka and Luca borrowed the current version of the parameters for me to test the responses. The results are now added to the plots with other models (the authors has named this force field as Orange):
Dehydration:
https://www.dropbox.com/s/bnhqeh3idacdz7u/OrderParameterDEHYD4.pdf
Effect of NaCl:
https://www.dropbox.com/s/ugnkq37c1mkwa8t/OrderParameterIONSnacl2.pdf
Effect of CaCl:
https://www.dropbox.com/s/nmj17m7i85nylvb/OrderParameterIONScacl.pdf
The response to the dehydration is similar to the MacRog and Berger, i.e. there is increase in beta which is not seen in the experiments.
However, this force has a remarkable property that Na ion partitioning into a bilayer is very low, thus significantly lower compared to the other tested force fields. This is illustrated in a plot with ion and lipid densities from Orange and MacRog force fields:
https://www.dropbox.com/s/zhrjh4mbsvhzb6d/IONdensORMacRog.png
This difference is also evident when order parameters for alpha and beta are plotted with larger scale together with experiments:
https://www.dropbox.com/s/oub4nx3absvsqbv/OrderParameterIONSexpVSsim.pdf
Despite the partition behaviour is in better agreement with experiments in the Orange force field, there is still room for improvement in the qualitative response to the penetrating charge (as seen from the results with Calsium).
I think that these results needs some further discussion but immediate conclusions seems to be that:
It is possible to significantly reduce the Na penetration by modifying the lipid model (I used the same ion model as in Berger simulations)
It seems that the changes in alpha order parameter can be related to the ion penetration in MD simulations (as assumed in ion partition coefficient measurements with NMR).
I am currently running a simulation with CHARMM model with NaCl. When I have results from those simulations, I will write a new post to review the current results on the responses.